Even though households only generate around 10 % of the total waste in the EU (Eurostat, 2016a and 2016b), household waste is still considered to be a very important topic and is currently at the forefront of EU policies, directives and regulations, including:
- Landfill Directive's (EC, 1999) - landfill diversion targets for biodegradable municipal waste
- The Packaging and Packaging Waste Directive’s (EC, 1994) - recycling targets
- The Waste Framework Directive’s (EC, 2008) - targets for recycling and preparation for reuse (more precisely; this target applies to specific types of household and similar waste).
All of these directives set targets and policies at EU level, including minimum requirements for managing certain waste types. Following the 3 golden rules; Reduce-Reuse-Recycle, waste prevention has the potential to reduce its environmental impact not only during the consumption and waste phases, but also throughout the whole life cycle of the products consumed.
476 kg per EU-inhabitant. Is it a little or a lot?
Based on the Eurostat, each EU citizen generated 475kg of waste, on average, in 2015 - meaning that every one of us generated about 1.3 kg of waste per day. Is that a little or a lot? Is there any potential to reduce or change the manner of our consumption and influence the amount of waste generated?
If we look back, then we can see that roughly the same amount was generated in the year 1995, so the trend seems to have remained fairly constant. However, if we look at different member countries (specifically 4 of the 8 FCC Environment countries) then we can see big differences; the lowest amount of waste generated per capita can be found in Romania (247 kg), Serbia (259 kg), Poland (286 kg) and Czech Republic (316 kg).
At the other end of the list we see Denmark (789 kg), Switzerland (725 kg) and Cyprus (638 kg). In reality, the figures are not easily comparable from country to country as each uses different methods of calculating waste generation (as well as different definitions within individual countries) and the reliability of data produced can be questionable, especially in CEE. Therefore, the EU circular economy has a clear target - the harmonization of waste generation, counting and calculation of recycling targets.
Waste generated per capita 1995/2015
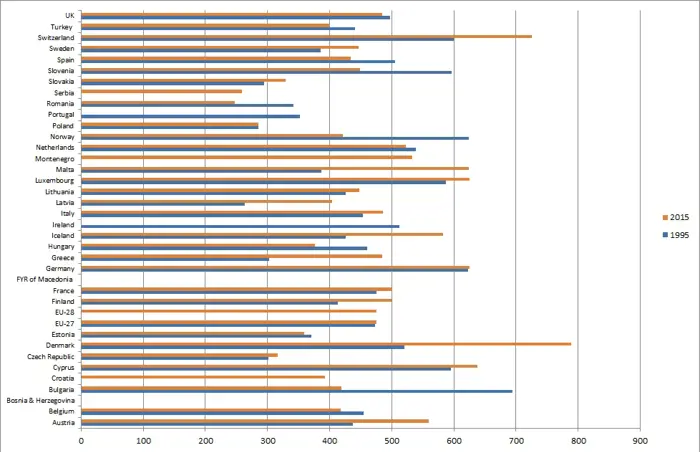
Base for data: Eurostat
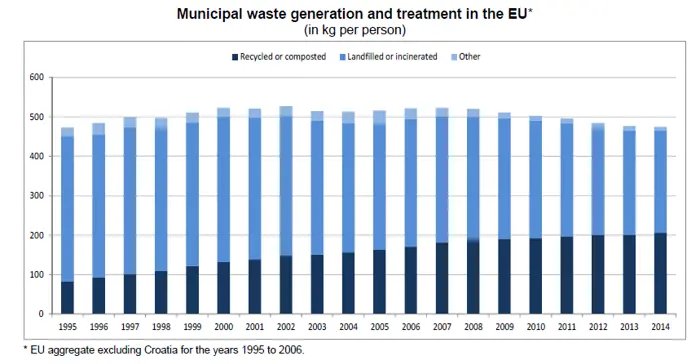
This is only one side of the coin, while the other side demonstrates what actually happens to the municipal waste which has been generated. This depends on the level of the current waste management system in each country, also on the actual "contents of our bins".
What really goes into our bins?
Acquiring such information isn't easy and we can only work with examples from some of the countries; since this type of information doesn't yet exist on any structured datasheet, EU-wide.
Let’s look at Czech Republic and Poland as examples;
In 2014, 26,946,718 tons of waste were generated in the Czech Republic. Municipal waste contributed about 12% of the total amount (3,337,336 tons) and of this waste; 23% was recycled and 15% was separated into fractions such as paper, plastics etc.
In Poland, municipal waste made up 8% of the total waste generated (10,863,000 tons), including 23 % of recyclables.
Czech waste bin

Waste recycling; are the EU-targets achievable?
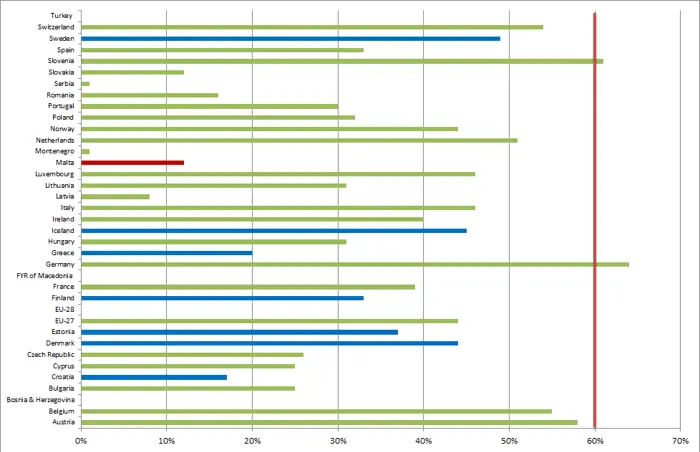
In 2015, the European Commission proposed new targets for municipal waste - with 60 % to be recycled and prepared for reuse (by 2025), rising to 65 % (by 2030). If we look at the following chart showing; the generation and treatment of municipal waste in the EU from 1995 - 2014, we have to ask whether achieving these goals is really possible.
Source: Eurostat
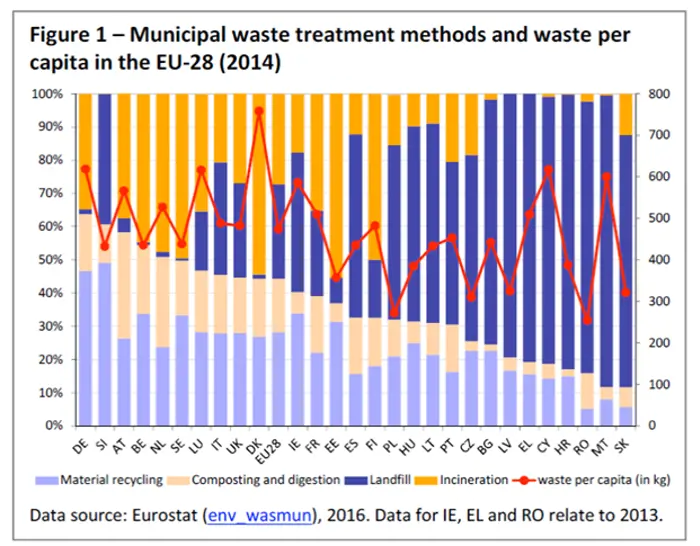
Until now, the target for 2025 (only 8 years from now), has only been achieved by Slovenia (61%) and Germany (64%), with over 40% in 12 other countries and an EU-wide average of 44%. But let´s consider what changes will be necessary to reach these targets in countries such as Serbia, Slovakia, or Romania to reach the goal of 60%, as they are currently only hovering at around 0-16%. It's going to be a massive challenge and it's difficult to predict whether the target can become reality in such a time frame. Only the future will show if these measures can truly be achieved.